Fig. 6.
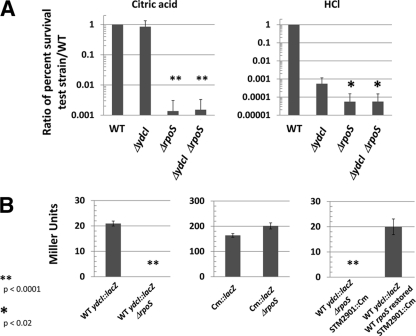
Relationship between ydcI and rpoS genes. (A) The indicated strains were subjected to acid stress (pH 3.5) with citric acid or HCl as indicated over a 30-min time period. The percent survival of the strains (compared to before the addition of stress) was calculated, and a ratio of the percent survival of the test strain to the WT strain is shown. Note that the phenotype of the ΔydcI mutant is similar to the WT for citric acid stress within 30 min (the data in Fig. 5 are from 120 min of acid stress). The P values were calculated as comparisons of the indicated strains and the ΔydcI single mutant strain. (B) Cultures of the indicated strains were assayed for LacZ activity and plotted for Miller units. All strains are in the χ3339 background, as indicated in Table 1. Cm::lacZ indicates that the lacZ gene in this strain is transcribed via the Cmr gene promoter. STM2901::Cm indicates the gene location of a Cmr marker linked to the WT rpoS gene within approximately 20 kb of DNA in the S. Typhimurium genome.

