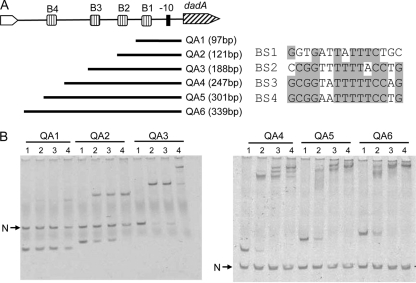
Fig. 5.
Gel shift analysis of DadR and different dadA promoter interactions. (A) Schematic presentations of four putative DadR boxes (B1 to B4) relative to the −10 element of the dadA promoter. Also shown are probes QA1 to -6, which cover different locations in the dadA regulatory region, and sequence alignment of DadR Boxes 1 to 4. (B) Electromobility shift assays with probes QA1 to -6. Each reaction mixture contains specific probes, as indicated at the top, and a negative control DNA (N), except reactions with probe QA3, where the negative control DNA was omitted. Concentrations of the DadR protein in lanes 1 to 4 were 0, 20, 40, and 80 nM, respectively.

