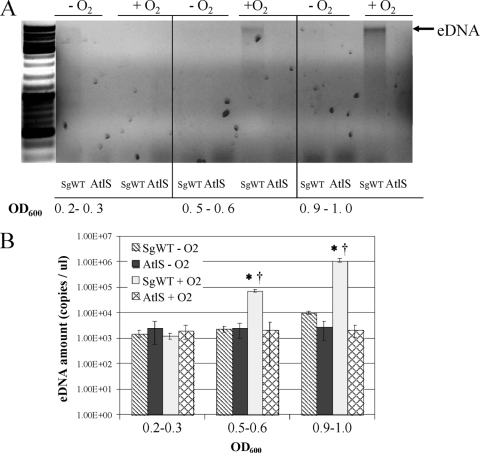
Fig. 4.
eDNA release by SgWT and AtlS-deficient S. gordonii as a function of growth domain. Cells were cultured in BHI broth under aerobic or anaerobic conditions. (A) Agarose gel electrophoresis (0.8%) of eDNA stained with ethidium bromide as described in the Materials and Methods section. The optical density (OD600) of the culture when harvested is presented below each panel, and the photographs are representative of three independent experiments that yielded similar results. (B) Quantitative real-time PCR of eDNA using the 16S rRNA gene as the amplification target. Data were normalized as detailed in Materials and Methods and represent the means and standard deviations of results of two independent experiments done in duplicate on different days. *, statistically significant differences among the same strain collected at different growth phases (P < 0.05 [Student t test]). †, statistically significant differences between the same strain cultured anaerobically and aerobically (P < 0.05 [Student t test]).

