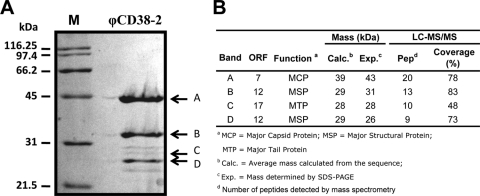
Fig. 3.
Analysis of φCD38-2 structural proteins. (A) Coomassie brilliant blue staining of a 12% SDS-polyacrylamide gel, showing φCD38-2 structural proteins, along with a protein molecular mass marker (lane M). Arrows and letters on the right correspond to protein bands identified by LC–MS-MS analysis, which are further characterized in panel B.

