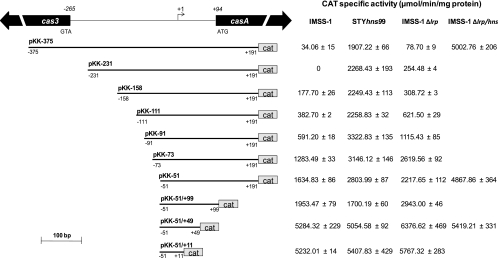
Fig. 4.
Promoter fusions harboring different lengths of the casA regulatory region. The bent arrow represents the transcriptional start site, located 94 bp upstream of the translational start codon of casA; the numbers in italics represent the localization of the casA and cas3 ATG initiation codons relative to the casA mRNA start site. Below the diagram of the regulatory region of casA, transcriptional fusions are shown. The fusions (in bold) were named according to the transcription initiation site; the numbers below each fusion represent the distances upstream and downstream of the mRNA start site. The right columns represent the expression of the casA fusions evaluated in the wild-type S. Typhi IMSS-1 strain, the single H-NS (STYhns99) and LRP (Δlrp) mutants, and the double Δlrp/hns mutant strain. The activities were determined at different ODs in rich medium (MA); the data presented correspond to the values obtained at an OD595 of 1.3. The values are the means ± standard deviations for at least three independent experiments performed in duplicate.

