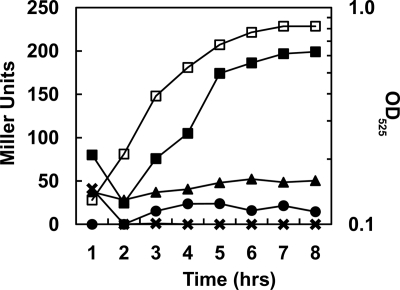
Fig. 2.
Transcription analysis of promoter P2. Time courses of β-galactosidase activity were carried out on E. faecalis V583 carrying the pP2 plasmid. M9HY medium was supplemented with 100 mM EA and 40 nM CoB12 (▪), 100 mM EA ( ), 40 nM CoB12 (•), or 100 mM glucose, 100 mM EA, and 40 nM CoB12 (▴). A representative growth curve in medium containing EA and CoB12 is shown (□), and the OD525 is indicated on the right axis.

