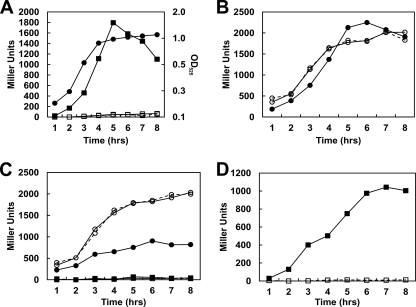
Fig. 4.
Transcription analysis of promoter P2-2. (A to C) Time courses of β-galactosidase activity were carried out for E. faecalis strains carrying plasmids pSP (A; squares) and pSP6 (B; circles). Panels A and B show the results obtained with the parental strain V583, and panel C shows the results obtained with the rr17 mutant strain. Dashed lines with open symbols are results for cultures grown in 100 mM glycerol; solid lines with closed symbols are results for cultures grown in 100 mM glycerol, 100 mM EA, and 40 nM CoB12; solid lines with open symbols are results for cultures grown in 100 mM glycerol and 40 nM CoB12. The assays for both strains were performed at the same time, but the graphs are separated for clarity. A representative growth curve in medium containing glycerol, EA, and CoB12 is shown in panel A with closed circles, and the OD525 is indicated on the right axis. (D) Results of transcription activity from plasmid pSP carried by the hk17 mutant strain; solid line with closed symbols shows the results for V583; dashed line with open symbols shows the results for the hk17 strain.

