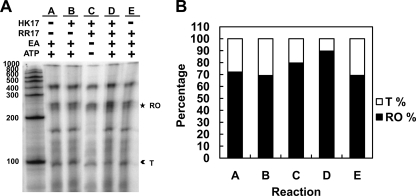
Fig. 7.
In vitro transcription assay of promoter P2-2 in the presence of RR17 and HK17. (A) Reactions were carried out on the SP template containing the P2-2 promoter. Shown are the products of the reaction mixtures incubated for 15 min. RNA products: runoff (RO; ★); terminated (T;  ). The gel with the products of the 120-min reactions showed essentially identical results (data not shown). (B) Quantification of RNA products from the in vitro termination assay shown in panel A. The percentages of RNA present in the RO and T bands were calculated as the fraction of the sum of the pixels of the RO and T bands from each reaction (4). Because the products are essentially end labeled (see Materials and Methods), the length of the transcripts is uninfluential in this calculation (4).

