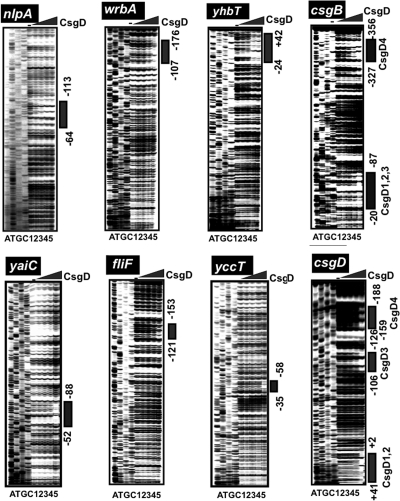
Fig. 2.
DNase I footprinting of CsgD-binding sites. Fluorescently labeled DNA fragments of the indicated CsgD target promoters (1.0 pmol each) were incubated in the absence (lane 1) or presence of increasing concentrations of purified CsgD (lanes 2 to 5 contain 2.5, 5, 10, and 20 pmol) and then subjected to DNase I footprinting assays. Lanes A, T, G, and C represent the sequence ladders. Bold lines on the right indicate the CsgD-binding sequences as detected by their protection pattern after DNase I treatment. The nucleotide numbers indicate the distances from the respective transcription start sites. The locations of CsgD-binding sites are illustrated in Fig. 3, below.

