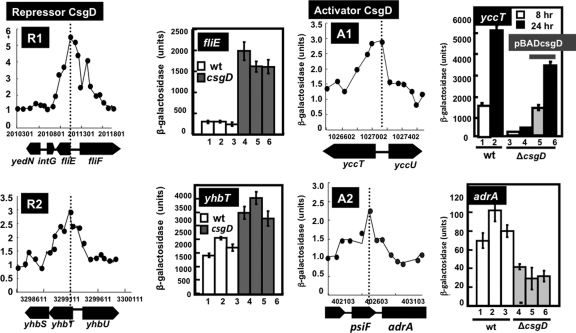
Fig. 6.
Classification of the regulation mode for CsgD. The promoter activity was measured in both the wild type and a csgD-defective mutant by using lacZ as a reporter. Based on the activity ratio between the wild type and csgD mutant, the test promoters were classified into repression mode (R1, fliE promoter; R2, yhbT promoter) and activation mode (A1, yccT promoter; A2, adrA promoter). For each promoter, both the ChIP-chip profile (left) and lacZ reporter activity (right) are shown. The sequences of peak regions are described in Fig. S1 of the supplemental material.

