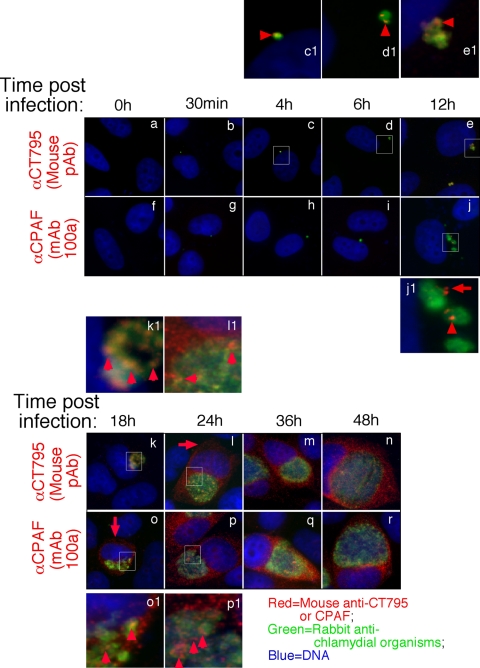
Fig. 6.
Time course expression of CT795 protein during C. trachomatis infection. The C. tracomatis-infected culture samples were processed at various times after infection (as indicated on the top) for immunofluorescence staining as described for Fig. 1. The mouse anti-CT795 (images a to e and k to n) and anti-CPAF (MAb 100a; panels f to j and o to r) antibodies were visualized with a goat anti-mouse IgG conjugated with Cy3 (red), while the chlamydia organisms were visualized with a rabbit antichlamydia antibody plus a goat anti-rabbit IgG-Cy2 conjugate (green). Areas amplified in separate images are marked with white squares, and the corresponding amplified images are labeled with the same letters followed by the number 1. Note that CT795 was first detected associated with the chlamydial inclusions at 4 h after infection (panels c and c1; red arrowheads), and CPAF was first detected at 12 h after infection (panels j and j1; the red arrow indicates CPAF dissociated from the inclusion, while the arrowhead indicates CPAF still associated with the inclusion). Significant cytosolic signal was first detected at 24 h postinfection for CT795 (l; red arrows) and at 18 h postinfection for CPAF (o; red arrow). Red arrowheads were used to mark signals still associated with the inclusions.

