Fig. 5.
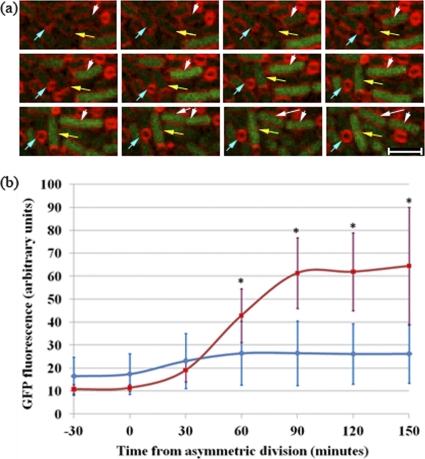
sda expression is increased in growing mother cells. (a). Time lapse images of a spoIIRdelay strain (SL15449) containing a Psda-gfp fusion for the visualization of sda transcription. Blue arrows indicate an example of a monosporic organism. Yellow and white arrows indicate two examples of organisms with mother cells growing after septation. In both examples, the prespore eventually detached from the growing mother cell, as observed previously (13). Membranes were visualized by staining with FM4-64. Images were taken every 30 min. Bar, 3 μm. (b) Quantitation of GFP levels present in the mother cells of different phenotypes of SL15449. The experiment illustrated in panel a was analyzed. GFP levels were analyzed for 26 monosporic organisms (blue) and 6 organisms with their mother cells growing after asymmetric division (red). Engulfment was completed 60 to 90 min after the asymmetric division in monosporic organisms. Mother cell growth was first observed about 90 min after septation for escaping mother cells. Asterisks indicate significant increases (P, <0.05 by the t test) in sda transcription in escaping mother cells.

