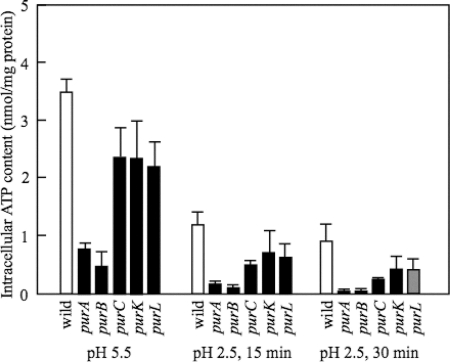
Fig. 5.
ATP content of various mutants at pH 5.5 and 2.5. W3110, W3110 purA, W3110 purB, W3110 purL, W3110 purC, and W3110 purK were used. The cells were cultured as described in the legend to Fig. 4. They were harvested at the indicated times at pH 2.5. The ATP contents were measured as described in Materials and Methods. The average values and standard deviations obtained from three experiments using separate cultures are represented.

