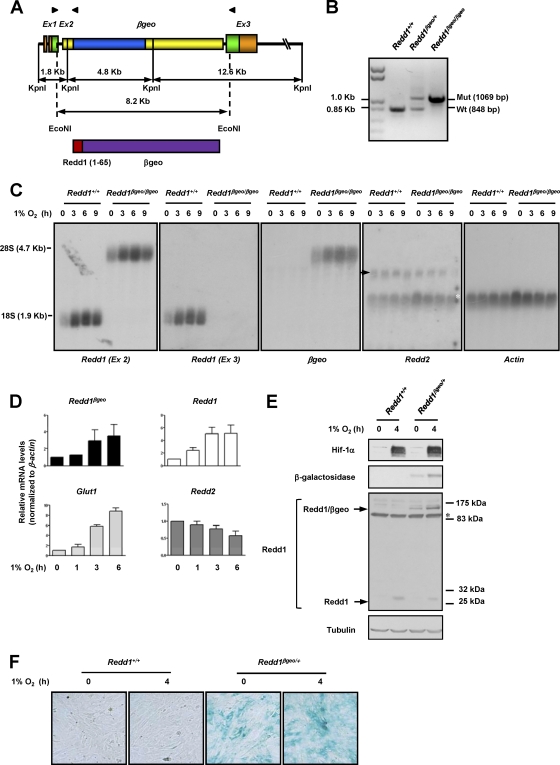
Fig. 1.
Insertion of a βgeo cassette in intron 2 of Redd1 results in a hypoxia-inducible chimeric protein that reports on Redd1 and disrupts Redd1 function. (A) (Top) Diagram depicting the genomic structure of Redd1βgeo. The genomic structure is not drawn to scale. Coding sequences are depicted in green and blue. Arrowheads illustrate the positions of primers used in panel B (see Materials and Methods for primer sequences). Ex, exon. (Bottom) Diagram of the predicted protein with amino acids 1 to 65 of Redd1. (B) PCR analysis of genomic DNA from samples of the indicated genotypes. Mut, mutant; Wt, wild type. (C) Northern blot analyses using the indicated probes on extracts from MEFs of the two different genotypes exposed to hypoxia for the indicated number of hours (the arrow indicates Redd2, and the white asterisk indicates residual actin signal). (D) qRT-PCR analysis of Redd1βgeo/+ MEFs exposed to hypoxia for the indicated number of hours (data are normalized to β-actin and represent means plus standard errors [SE] [error bars]; n = 2). (E) Western blots of MEFs of the two genotypes exposed to hypoxia for the indicated number of hours (the asterisk indicates cross-reacting protein). (F) X-Gal staining of MEFs of the two genotypes and exposed to hypoxia for the indicated number of hours.

