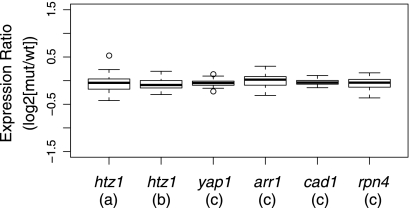
Fig. 4.
Expression ratios of elongation genes. The 56 yeast genes with GO annotations for Pol II transcription elongation were compared for their expression ratios in two independent htz1Δ data sets and four site-specific DNA binding transcriptional activators. The distribution of normalized log2 expression ratios is shown in the box plots. Expression ratios within the second and third quartiles are boxed, and the whiskers extend to 1.5 times the interquartile range. The medians are shown as the solid bars in the boxes, and outliers are indicated by open circles. (a) Data for htz1Δ from reference 65; (b) data for htz1Δ from reference 67; (c) data for transcriptional activator genes YAP1, ARR1, CAD1, and RPN4 from reference 36 (Gene Expression Omnibus series GSE1798).

