Fig. 9.
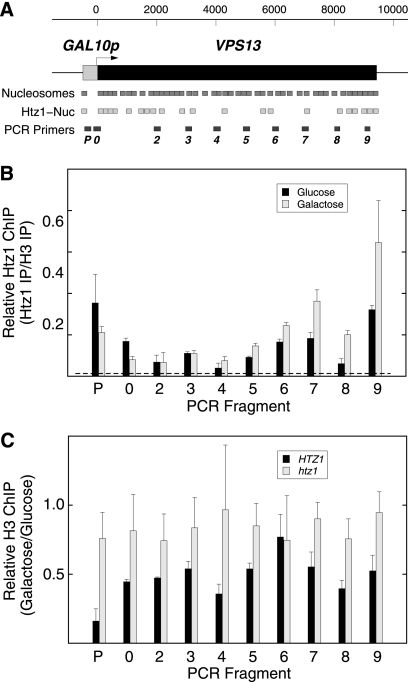
Htz1-containing nucleosomes decorate the GAL10p-VPS13 locus under inducing and repressing conditions. (A) The positions for the Htz1-containing nucleosomes and canonical nucleosomes are shown (2). At the bottom, the positions for the 10 PCR fragments used in the ChIP analysis of HA-Htz1 and H3 across the GAL10p-VPS13 locus are shown. (B) The ratio of Htz1 abundance versus H3 is shown for cells growing at steady state under repressing conditions on glucose and under inducing conditions on galactose. The data shown are the averages of two independent experiments. (C) The relative H3 occupancy across the GAL10p-VPS13 locus on galactose versus glucose is shown for HTZ1 and htz1 strains.

