Fig. 2.
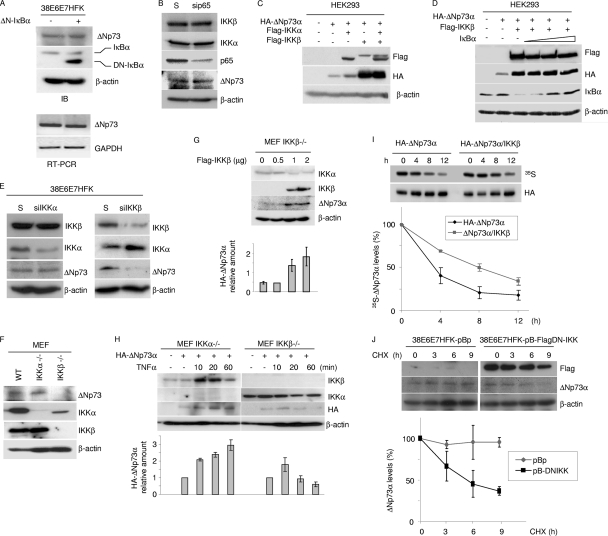
IKKβ increases ΔNp73 protein levels. (A) 38E6E7HFK cells were transduced with pBp or with pBp-ΔN-IκBα superrepressor (ΔN-IκBα). Protein extracts were analyzed by immunoblotting using the indicated antibodies (top panel). Total RNA was also extracted from both cell lines, and ΔNp73 or GAPDH mRNA levels were measured by RT-PCR (bottom panel). (B) Scrambled (S) RNA and siRNA for p65 (sip65) was transfected in 38E6E7HFK cells. Thirty-six hours after transfection, protein extracts were analyzed by immunoblotting with the indicated antibodies. (C and D) HEK293 cells were transfected with different expression constructs as indicated. After 24 h, protein extracts were analyzed by immunoblotting with the indicated antibodies. (E) Scrambled (S) RNA and siRNA for IKKα (siIKKα) or IKKβ (siIKKβ) was transfected in 38E6E7HFK cells. Thirty-six hours after transfection, protein extracts were analyzed by immunoblotting with the indicated antibodies. (F) IKKα/β+/+ (WT), IKKα−/−, and IKKβ−/− MEF cellular protein extracts were analyzed by immunoblotting with the indicated antibodies. (G) IKKβ−/− MEF cells were transfected with increasing concentrations of pcDNA3-Flag-IKKβ, and 24 h after transfection, protein extracts were analyzed by immunoblotting with the indicated antibodies (top panel). The ΔNp73 protein signal was quantified by the Quantity One software program (Bio-Rad), normalized on the levels of β-actin, and the values obtained were reported in the histogram (bottom panel). The data are the means of results from two independent experiments. (H) IKKα−/− MEF and IKKβ−/− MEF cells were transfected with pcDNA3-HA-ΔNp73α and treated with TNF-α at the indicated time points. Protein extracts were analyzed by immunoblotting with the indicated antibodies (top panel). The amounts of HA-ΔNp73 signal in the Western blot were quantified as explained for panel G and are reported in the histogram (bottom panel). The data are the means of results from two independent experiments. (I) HEK293 cells were transfected with HA-tagged ΔNp73α in the absence or presence of overexpressed Flag-tagged IKKβ. Twenty-four hours after transfection, cells were labeled for 1 h with l- [35S]methionine, chased for the indicated times, and collected. Following anti-HA immunoprecipitation, the immunocomplexes were loaded on an SDS-PAGE gel and transferred onto a polyvinylidene difluoride (PVDF) membrane. Autoradiography (top panel) and then anti-HA Western blotting (middle panel) were performed; 35S-HA-ΔNp73 bands were quantified by Image Lab (Bio-Rad) and normalized on the total levels of immunoprecipitated HA-ΔNp73 protein. The percentage of ΔNp73 at time zero was referred to as 100%, and the percentages of protein at the different time points were calculated relative to that at time zero and reported in the histogram (lower panel). The data are the means of results for two independent experiments. (J) 38E6E7HFK cells stably expressing a dominant-negative inhibitor of IKKβ (pB-FlagDN-IKK) were generated and cultured in the presence of CHX for the indicated number of hours. At each time point, cells were collected. Protein extracts were prepared and analyzed by immunoblotting with the indicated antibodies (upper panel). The levels of ΔNp73 were quantified by Quantity One (Bio-Rad) and normalized on the levels of β-actin. The percentages of ΔNp73 at the different time points were calculated as for Fig. 1G and are reported in the histogram (lower panel). The data are the means of results for two independent experiments.

