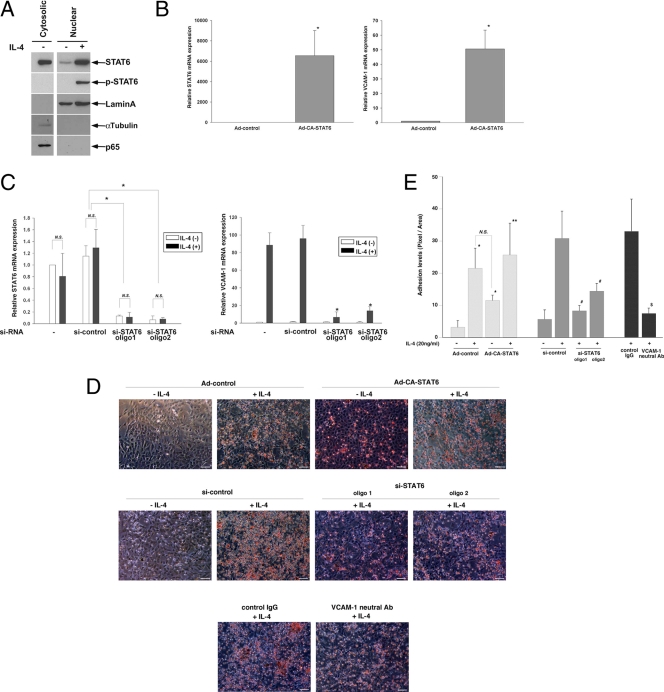
Fig. 3.
Role of STAT6 in IL-4-mediated induction of VCAM-1 and monocyte adhesion in primary cultured endothelial cells. (A) HUVECs were treated in the presence or absence of 20 ng/ml IL-4 and then processed for cytosolic and nuclear fractions. Western blot analysis was carried out using antibodies against total STAT6, phospho-STAT6, nuclear lamin A, cytosolic α-tubulin, and p65 NF-κB. (B) HUVECs were treated with Ad-control or Ad-CA-STAT6. STAT6 (left) and VCAM-1 (right) mRNA levels were measured by quantitative real-time PCR. The results show the means and standard deviations of expression levels relative to Ad-control, derived from three independent experiments. *, P < 0.001 compared with Ad-control. (C) HUVECs were transfected with si-control or two independent siRNAs against STAT6 (oligo1 or oligo2), serum starved, and then treated with 20 ng/ml IL-4 for 24 h. STAT6 (left) and VCAM-1 (right) mRNA levels were measured by quantitative real-time PCR. The results show the means and standard deviations of expression levels relative to si-control in the absence of IL-4 treatment, derived from at least four independent experiments. *, P < 0.01 compared with si-control-treated cells in the presence of IL-4. N.S., nonsignificant. (D and E) U937 monocytic cell adhesion assays were carried out as described in Materials and Methods. HUVECs were infected with Ad-control or Ad-CA-STAT6 or transfected with si-control or si-STAT6, preincubated with control IgG or neutralizing antibody against VCAM-1, treated with 20 ng/ml IL-4 for 24 h, and then washed and incubated with U937 monocytes. The results are representative of four independent optical images from three independent experiments. Bar, 50 μm. Adhesion levels were quantitated (E). *, P < 0.01, compared with Ad-control minus IL-4; **, P = 0.045 compared with Ad-CA-STAT6 minus IL-4; #, P < 0.01 compared with si-control plus IL-4; and $, P < 0.01 compared with control IgG.

