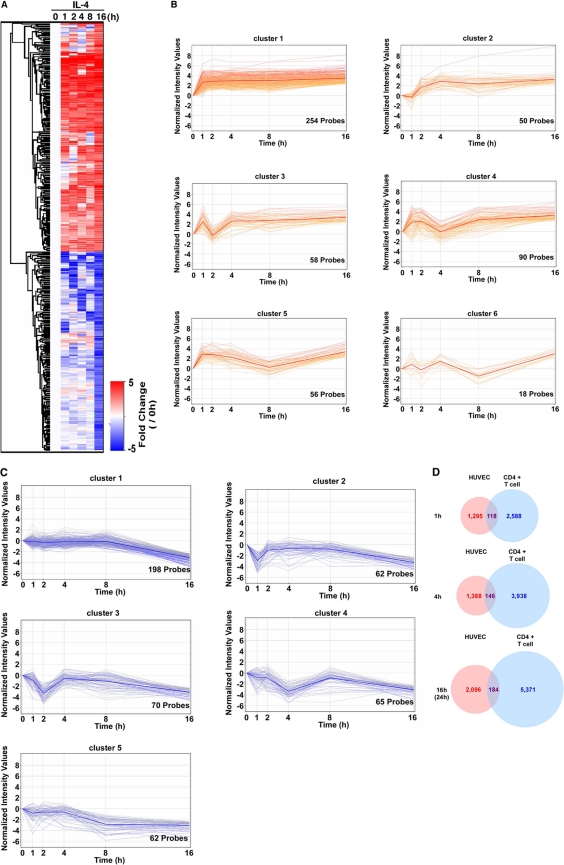
Fig. 4.
Genome-wide analysis of IL-4-mediated up- or downregulated genes in primary cultured endothelial cells. (A) Heat map representation of IL-4-regulated genes. The color intensity indicates the expression level (upregulated in red and downregulated in blue relative to the median in white). A total of 983 probes demonstrating >5-fold upregulation or downregulation in the presence of IL-4 for 16 h were clustered at indicated time points. (B) Kinetics of IL-4-induced genes (526 probes) using Gene Spring software (Agilent). The bold line indicates the median of all probes in each cluster. (C) Kinetics of IL-4-repressed genes (457 probes) using Gene Spring software. The bold line indicates the median of all probes in each cluster. (D) Venn diagram showing overlap of IL-4-induced genes in HUVECs and CD4+ T cells. Whole probes were selected based on >2-fold induction after IL-4 treatment at 1, 4, and 16 h (HUVECs) or 1, 4, and 24 h (T cells).

