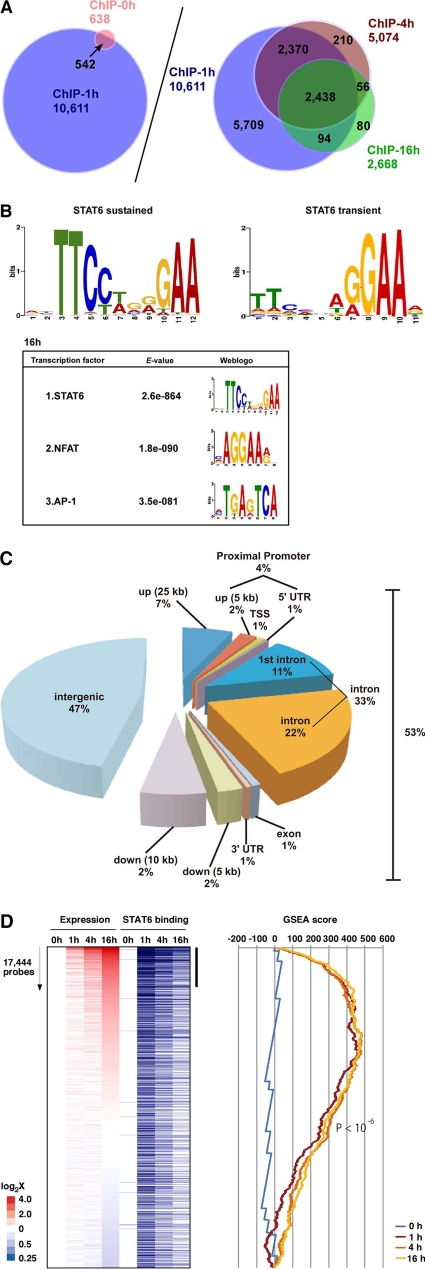
Fig. 5.
Genome-wide ChIP-seq analysis of IL-4-mediated STAT6 binding in primary cultured endothelial cells. (A) ChIP-seq analysis was used to survey genome-wide STAT6 binding in HUVECs treated with IL-4 for 0, 1, 4 and 16 h. (B, upper) De novo search for STAT6 binding recognition sequence based on sustained or transient binding in HUVEC. (Lower) Second and third enriched motifs calculated by the MEME method. The E-value indicates the probability of de novo enriched sequences obtained from ChIP-seq. (C) Distribution of STAT6 binding sites in the proximal promoter (within 5 kb upstream of the 5′ untranscribed region [UTR] from the transcriptional start site [TSS]), exon, intron, and intergenic regions (defined by regions 25 kb upstream and 10 kb downstream from the TSS). (D) IL-4-responsive genes (based on 17,444 probes [representing ∼8,500 genes] in DNA microarrays) at 1, 4, and 16 h, sorted according to the induction ratio at 16 h (left). Genes are aligned with results of ChIP-seq (blue bars indicate STAT6 binding). The vertical black bar indicates a group of highly induced IL-4-responsive genes at 16 h that are enriched in STAT6 binding. A graphic representation of the GSEA enrichment score is shown on the right.

