Fig. 1.
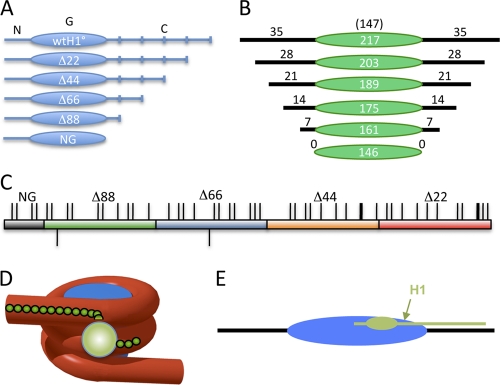
Schematic of the H1 C-terminal domain and model for the nucleosome-H1 complex. (A) Linker histone domains and deletion mutants used in this study. N, G, and C indicate the N-terminal, globular, and C-terminal domains of the protein. Deletion mutants are denoted according to the number of residues deleted from the C terminus of the protein. (B) Constructs used for nucleosome binding experiments. The green oval indicates the 147-bp nucleosome core DNA (not to scale). Black numbers and lines indicate base pairs in each linker region. (C) Schematic of the Xenopus laevis H1(0) CTD. Thin and thick ticks above the bar indicate lysines and arginines, respectively; ticks below indicate the two glutamic acid residues in the CTD. The red, orange, blue, green, and gray sections indicate the regions accumulatively deleted in Δ22, Δ44, Δ66, Δ88, and NG, respectively. Note that eight additional residues were deleted in NG compared to Δ88. (D and E) Models for H1 interaction with the nucleosome showing the globular domain binding at the nucleosome dyad (sphere or oval) and the CTD extending linearly along a linker DNA segment.

