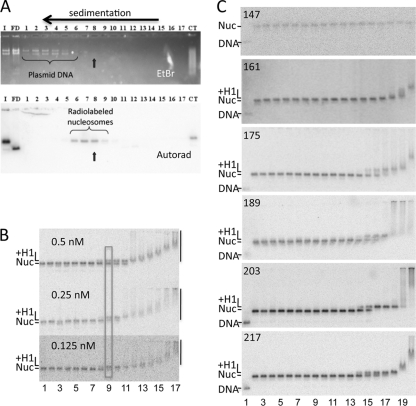
Fig. 2.
H1 binding to nucleosomes with different lengths of linker DNA. (A) Purification of reconstituted nucleosomes. Nucleosomes were fractionated on 7 to 20% sucrose gradients to remove plasmid carrier DNA. Fractions 1 to 17 were run on a 0.7% agarose nucleoprotein gel. I, input sample after nucleosome reconstitution; FD, free DNA; CT, a nucleosome control in which samples were reconstituted with calf thymus DNA instead of plasmid as a carrier. Top and bottom panels show the ethidium bromide (EtBr)-stained gel and autoradiograph of the same gel after drying. Fraction 8 was chosen for H1 binding experiments. (B) Binding is driven by protein concentration. Three binding experiments with decreasing 217N nucleosome concentrations, as indicated, are shown. H1 concentrations in lanes 1 to 17 were 0, 0.03, 0.05, 0.1, 0.2, 0.5, 1, 2, 4, 8, 15, 30, 60, 100, 200, 300, and 400 nM, respectively. Bands corresponding to free nucleosome (Nuc), H1-nucleosome complex (+H1), and H1-induced nucleosome aggregates (vertical bars) are indicated. The approximate midpoint in the binding transition is indicated by the rectangle. (C) Representative gels showing H1 binding to 147N, 161N, 175N, 189N, 203N, and 217N nucleosomes as depicted in Fig. 1B. Lanes 1 and 2 show the naked DNA fragment and nucleosomes in the absence of H1. Nucleosomes in lanes 2 to 20 were incubated with H1 at final concentrations of 1, 2, 4, 8, 15, 30, 60, 120, and 240 pM and 0.48, 0.96, 1.9, 3.9, 7.7, 15, 30, 60 and 120 nM, respectively. The positions of naked DNA, nucleosomes, H1-bound nucleosomes, and H1-induced aggregates are indicated as in panel B.

