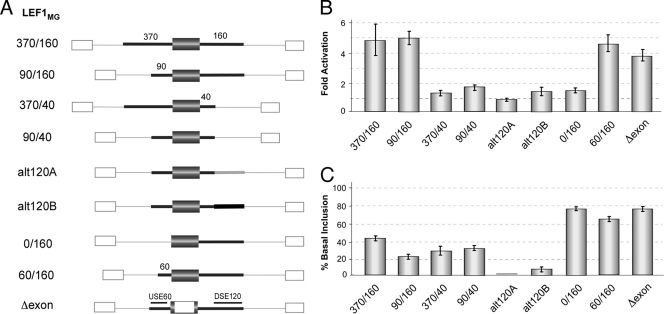
Fig. 3.
Intronic sequences flanking LEF1 exon 6 function as signal-induced enhancers of exon inclusion. (A) Schematic representations of the minigenes used. The gray box and thick lines correspond to exon 6 and flanking intron sequences from LEF1, respectively. The numbers above the lines give the approximate length of included LEF1 endogenous sequence. The white boxes and thin lines correspond to exon and intron sequences derived from the human beta-globin gene, respectively. The thick light gray and black lines in constructs alt120A and alt120B correspond to heterologous sequence used as filler. All constructs were expressed from a constitutive, heterologous promoter. (B) Graph of fold activation, as defined in the legend to Fig. 1, of exon 6 inclusion in each of the minigenes upon 60-h PMA stimulation of JSL1 cells. The values are the averages of 3 or 4 independent experiments with error bars indicating standard deviations. (C) Graph of the amount of exon 6 inclusion in each of the minigenes expressed in resting cells (basal inclusion). Values were calculated and graphed as for panel B.

