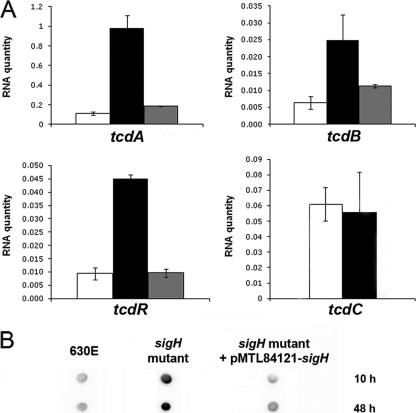
Fig. 1.
Effects of SigH inactivation on the expression of pathogenicity locus genes. (A) Expression of tcdA, tcdB, tcdR, and tcdC in strain 630E (white), in a sigH mutant (black), and in strain CDIP12 (sigH mutant complemented with pMTL84121-sigH) (gray) after 10 h of growth in TY medium. After reverse transcription, specific cDNAs were quantified by qRT-PCR, using the 16S rRNA gene for normalization and standard curve. The mean normalized quantity of RNA is indicated in arbitrary units. Error bars correspond to standard deviations from at least two biological replicates. (B) The TcdA level was estimated from crude extracts by protein dot blot analysis using specific monoclonal antibodies raised against TcdA. Crude extracts were obtained after 10 h and 48 h of growth in TY. The results shown are representative of at least three biological replicates of C. difficile crude extracts.

