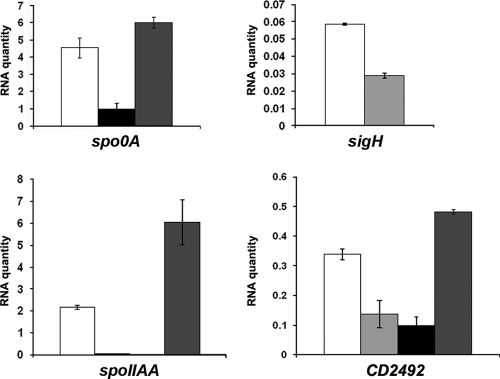
Fig. 2.
qRT-PCR analysis of the role of SigH and Spo0A in the control of spo0A, sigH, CD2492, and spoIIAA gene expression. Total RNAs were extracted from C. difficile strain 630E (white), the spo0A mutant (pale gray), the sigH mutant (black), and strain CDIP12 (sigH mutant complemented with pMTL84121-sigH) (dark gray) grown in TY medium. After reverse transcription, specific cDNAs were quantified by qRT-PCR, using the 16S rRNA gene for normalization and standard curve. Error bars correspond to standard deviations from at least two biological replicates.

