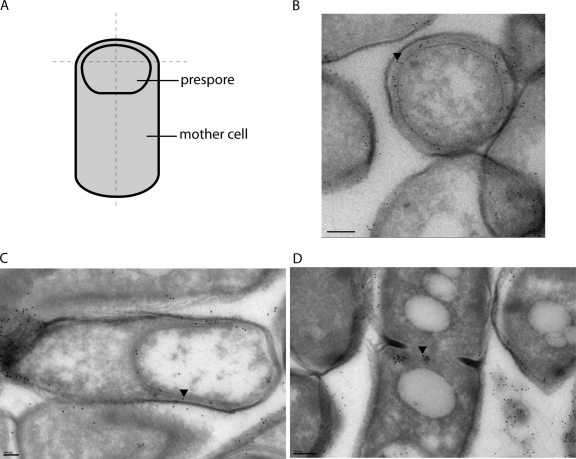
Fig. 9.
Subcellular localization of B. cereus CDP-Chase. (A) Depiction of a stage III sporangium. Dashed lines indicate manner of cell slicing. (B) A stage III sporangium treated with primary antibody against CDP-Chase and visualized with gold-conjugated secondary antibody (black dots). This cell is sliced in a manner similar to the horizontal dashed line in panel A. (C) A stage III sporangium sliced in an orientation similar to the vertical dashed line in panel A. (D) A dividing vegetative cell. Black arrowheads were placed in B, C, and D to indicate the locations of single gold particles as a guide for visualization. Bars, 200 nm (B and D) and 100 nm (C).

