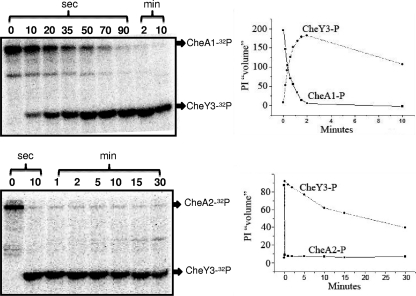
Fig. 6.
Transfer of phosphate from CheA1-32P (top panels) and CheA2-32P (bottom panels) to CheY3. CheA1 and CheA2 were autophosphorylated with [32P]ATP, and unincorporated [32P]ATP was removed by centrifugation on Bio-Spin6 columns. Recovered CheA1-32P and CheA2-32P (2 μM each) were incubated with 14.8 μM CheY3 for the indicated periods of time. Reactions were stopped, and products were analyzed as described in the text. Phosphor images are shown in the left panels, and relative intensities (PI “volumes”) are shown in the right panels. CheA1-32P and CheA2-32P are represented as solid lines and squares, and CheY3-P is represented as circles and dashed lines.

