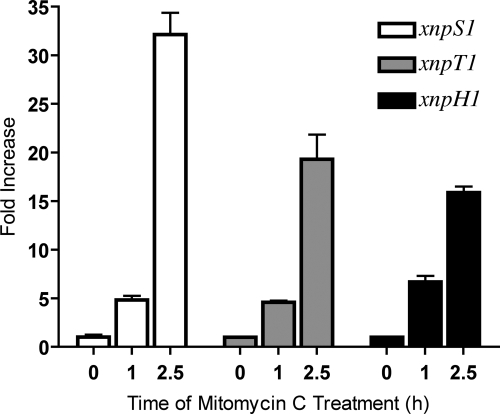
Fig. 2.
xnp1 gene expression is induced by mitomycin C treatment. Results shown are for qRT-PCR analysis of xnp1 gene expression before treatment with mitomycin C (0 h) and 1 h and 2.5 h after induction. For each gene, time zero was arbitrarily set to 1. The fold changes at stimulated time points (1 h and 2.5 h) are relative to the untreated sample (0 h).

