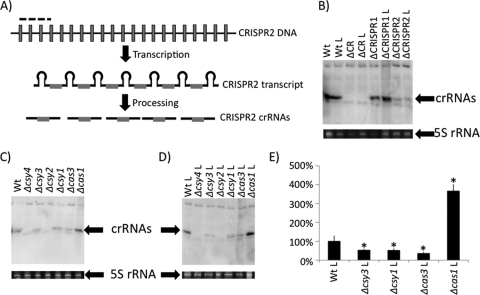
Fig. 2.
Characterization of small crRNA production by CRISPR region mutants. (A) Diagram showing CRISPR DNA transcribed into a long CRISPR transcript, which is processed into mature crRNAs by Cas proteins. The portion of CRISPR2 utilized as the probe for Northern blot analysis is denoted by a dashed line. Unique spacer sequences are shown as gray boxes, while repeat sequences are represented by black lines. (B) Detection of in vivo small crRNA production by WT, ΔCRISPR1, ΔCRISPR2, and ΔCRISPR region nonlysogens and lysogens by using Northern blot analysis. Also shown is the 5S rRNA band for each of the corresponding RNA preparations used in the Northern blot analysis. (C) Shown is a representative Northern blot (top) of crRNA production by each cas mutant in the absence of DMS3. Also shown is the 5S rRNA band for each of the corresponding RNA preparations used in the Northern blot analysis. (D) Shown is a representative Northern blot (top) of crRNA production by cas mutants in the presence of DMS3 (lysogens). Also shown is the 5S rRNA band for each of the corresponding RNA preparations used in the Northern blot analysis. (E) Quantification of representative data shown in panel D. Shown is an average calculated from three replicate experiments. The bars indicate standard deviation. *, Significantly different from the WT, P < 0.05. An “L” following the genotype designation indicates a strain lysogenized with DMS3.

