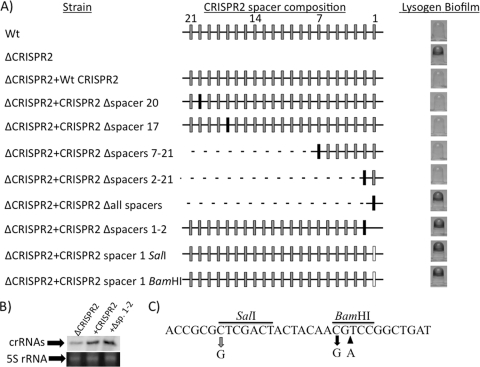
Fig. 6.
CRISPR2 spacer content required for bacteriophage-mediated biofilm inhibition. (A) The left column shows the name of the WT or CRISPR2 mutant strain diagrammed in the center column. The CRISPR2 schematic representation depicts repeat sequences as black lines, deleted sequence as dotted lines, WT spacers of PA14 CRISPR2 as gray boxes, P. aeruginosa strain 2192 CRISPR1 spacer 8 as black boxes, and point mutations within spacer 1 as white boxes. Wild-type PA14 CRISPR2 spacer numbers are shown in intervals of 7 at the top of the center column, allowing orientation of various spacer mutations. The right column provides a representative image of the biofilm phenotype of each DMS3-infected WT and mutant strain. (B) Northern blot analysis demonstrating that the Δspacers1-2 (Δsp. 1–2) mutant produces a level of small crRNAs similar to that of the WT CRISPR2-complemented strain. The three spacers and two repeats closest to the cas1 gene of CRISPR2 of P. aeruginosa PA14 were used as the probe. Also shown at the bottom of this panel is the 5S rRNA band for each of the corresponding RNA preparations used in the Northern blot analysis. (C) Shown is the sequence of CRISPR2 spacer 1. The gray arrow shows the site of the mutation caused by introduction of the SalI site, and the black arrows show the site of the mutation (left arrow) and base insertion (right arrow) caused by introduction of the BamHI site. The black bar indicates the nucleotides comprising the restriction sites.

