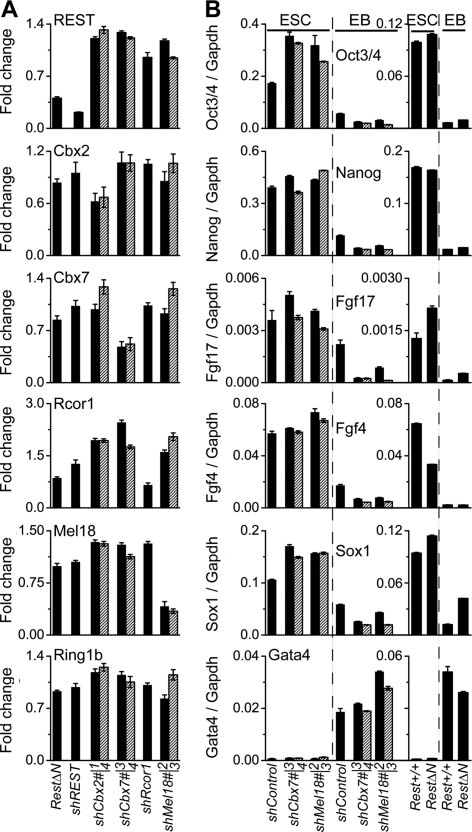
Fig. 6.
Selectivity of REST, Rcor1, and PRC1 subunit knockdown and RestΔN knockout. (A) Effects of RestΔN knockout and of the shRNA constructs indicated below the bars on the REST and PRC1 subunit transcripts indicated above the bars. The bars show the ratios between the transcript levels in RestΔN knockout cells and those in Rest+/+control cells or between the transcript levels in cells expressing the knockdown shRNA and those in cells expressing the control shRNA. Two different shRNAs directed against different sequences in Cbx2, Cbx7, and Mel18 were used (solid bars and striped bars). The primers used to detect REST transcripts also detect transcripts from the RestΔN knockout locus. The results shown represent the means of data from two or more independent experiments. (B) Effects of the RestΔN knockout and of the shRNA constructs indicated below the bars on the levels of the pluripotency- and differentiation-associated transcripts indicated above the bars. The transcript levels were measured in ES cells (ESC) and in embryoid bodies (EB) and were normalized relative to Gapdh levels.

