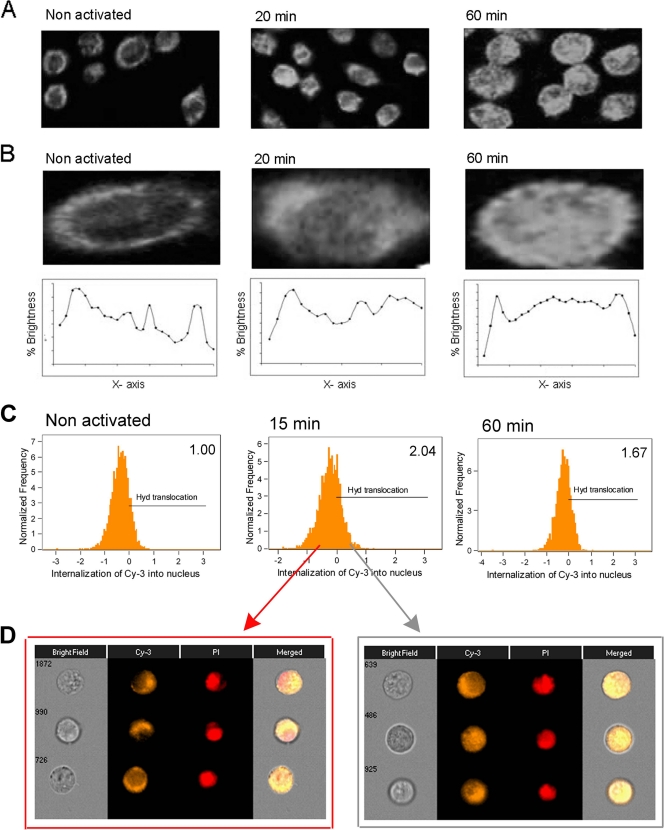
Fig. 2.
Identification of Ap4A hydrolase nuclear translocation in RBL cells following IgE-Ag activation. (A) RBL cells were either quiescent or sensitized with IgE and then were challenged with antigen for 20 or 60 min. Immunostaining was performed with anti-Ap4A hydrolase. The cells were analyzed by confocal laser scanning microscopy. Images for one representative experiment of three are presented. (B) One representative cell from the field is shown at high magnification. Using Photoshop picture-editing software, the percent brightness parameter was determined at specific intervals along the x axis. (C) RBL cells were activated (or not) with IgE, challenged with Ag for specific times, and then stained for Ap4A hydrolase by anti-Ap4A hydrolase followed by Cy3-conjugated anti-rabbit, together with PI staining to visualize nuclei. Nuclear translocation was evaluated by ImageStream flow cytometry. For each treatment, 5,000 cells were collected. Positive single cells were gated, and nuclear translocation of Ap4A hydrolase was plotted. The relative translocated population size is indicated in the upper right corner. (D) Representative images of untranslocated (left) and translocated (right) Ap4A hydrolase (Cy3 column), as well as PI and merged images, for the 15-min treatment.

