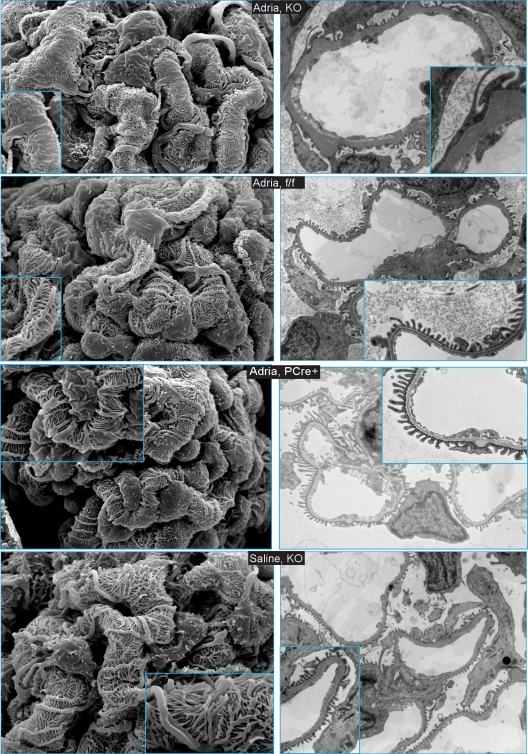
Fig. 5.
Scanning electron microscopy (left panels) and transmission electron microscopy (right panels) reveal changes in foot process architecture in KO mice injected with doxorubicin hydrochloride. Scanning EM of glomeruli was performed at low power (×3,000) and high power (inset; ×10,000). Transmission EM images were obtained at low power (×6,000 to ×7,500) and high power (inset; ×15,000 to ×25,000). Genotypes are indicated in the center of each row. Images for ff control mice and PCre+ control mice injected with saline were similar to those for KO mice injected with saline and are not shown.

