Fig. 4.
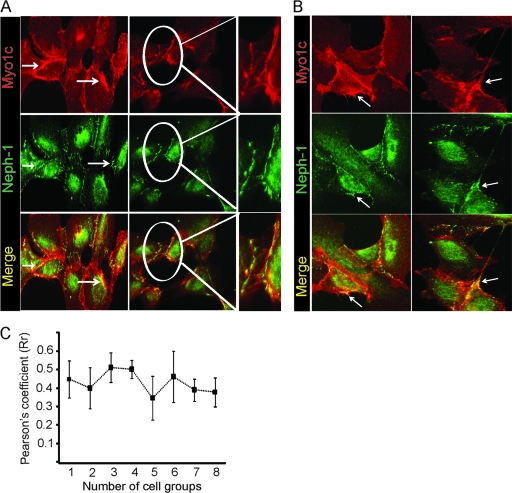
Myo1c and Neph1 colocalize in cultured human podocytes. (A and B) Cultured podocytes grown on coverslips were fixed with 4% PFA and immunolabeled with Myo1c (red) and Neph1 (green) antibodies. As noted previously, Neph1 is concentrated at the cell membrane, while Myo1c is widely distributed in the cytoplasm and enriched at the cell membrane. The red-green overlay (yellow) shows Myo1c and Neph1 colocalization close to the cell membrane, in cell processes or lamellipodia, and also at cell-cell contacts in adjacent enlarged images. Representative images from five different experiments are shown, the junction region from one set of images is enlarged, and Neph1 and Myo1c colocalization is highlighted. (C) The Pearson's correlation coefficient (Rr) at the cell boundary of podocytes was calculated by using Image J software and shows a partial colocalization of Myo1c with Neph1, with an Rr of ∼0.4. Eight different cell groups (n = 8 cells) were included from five different experiments for quantitation.

