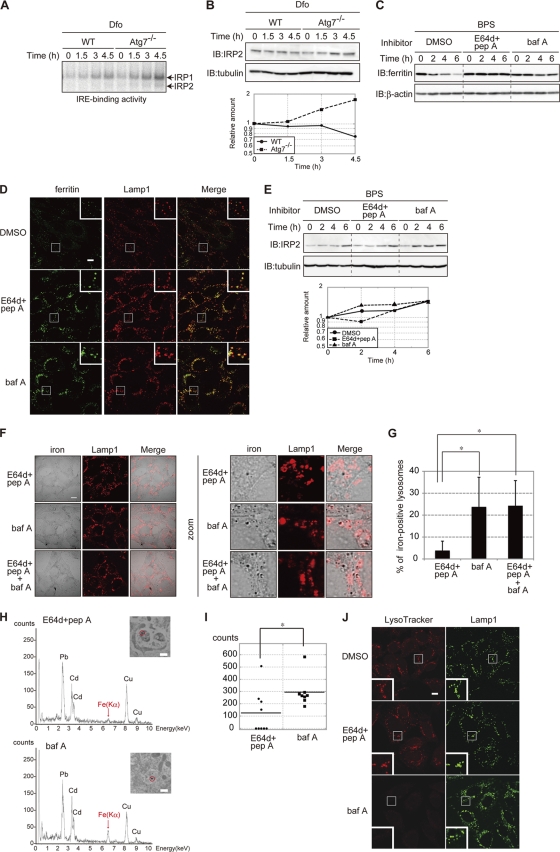
Fig. 3.
Lysosomal acidification is crucial for the extraction of ferritin iron. (A, B) Accelerated IRE binding by IRP1 and IRP2 (A), and IRP2 levels (B) in Atg7 KO MEFs. WT and Atg7 KO MEFs pretreated with FAC were cultured in the presence of Dfo for the indicated times. The IRE-binding activities of IRP1 and IRP2 (A) and the levels of IRP2 (B) were assessed. The amount of IRP2 is quantified (B). (C) Stabilization of ferritin in cells treated with inhibitors of lysosomal proteases. MEFs pretreated with FAC were cultured in the presence of the indicated inhibitor(s) or DMSO for the indicated times. Cell lysates were probed as described in the legend to Fig. 1A. pep A, pepstatin A; baf A, bafilomycin A1. (D) Localization of ferritin to lysosomes in cells treated with lysosomal inhibitors. MEFs pretreated with FAC were cultured as described for panel C for 4 h and coimmunostained with antiferritin and anti-Lamp1. Higher-magnification views of the boxed areas are shown in the insets. Scale bar, 10 μm. (E) Accelerated accumulation of IRP2 in MEFs treated with bafilomycin A1. MEFs cultured as described for panel C were probed as described for panel B. The amounts of IRP2 were quantified. (F, G) Colocalization of iron and Lamp1 in MEFs treated with E64d-pepstatin A, bafilomycin A1, or bafilomycin A1 and E64d-pepstatin A. MEFs pretreated with FAC were cultured in the presence of the indicated inhibitor(s) and BPS for 4 h. Cells were stained with Perl's solution and DAB, followed by immunostaining with anti-Lamp1. Scale bar, 10 μm. (F). Iron-positive lysosomes were counted in 10 E64d-pepstatin A-treated cells, 11 bafilomycin A1-treated cells, and 11 E64d-pepstatin A- and bafilomycin A1-treated cells. The percentages of iron-positive lysosomes are shown. Error bars show standard deviations. *, P < 0.01 (G). (H, I) Accumulation of iron in lysosomes in bafilomycin A1-treated MEFs. (H) MEFs were treated as described for panel F, and EDX spectra were recorded at 200 kV. Representative spectra of selected lysosomes (inset, marked by a circle) are shown. Scale bar, 500 nm. Absorption peaks are labeled with symbols of the elements detected. (I) The intensities of Fe(Kα) peaks in nine lysosomes from E64d-pepstatin A- or eight lysosomes from bafilomycin A1-treated cells are shown. Horizontal bars show the means. *, P < 0.05. (J) Increased pH in bafilomycin A1-treated MEFs. MEFs were treated as described for panel F and incubated with LysoTracker Red for the last 1.5 h of incubation, followed by immunostaining with anti-Lamp1. Higher-magnification views of the boxed areas are shown in the insets. Scale bar, 10 μm.

