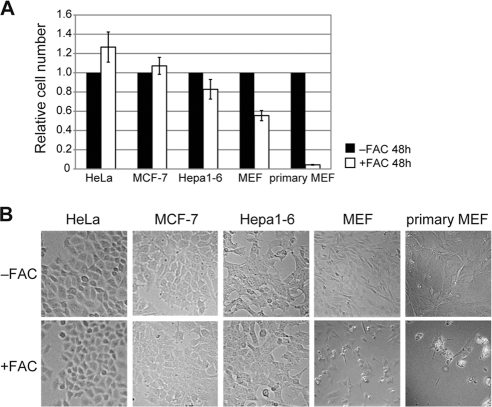
Fig. 7.
Differences in iron susceptibility between primary and cancer-derived cells. Cells were cultured in the presence or absence of FAC for 48 h. (A) Relative cell numbers are the ratios of the cell numbers in the presence of FAC to the cell numbers in the absence of FAC. Error bars show standard deviations. (B) Cells cultured in the presence or absence of FAC for 48 h are shown.

