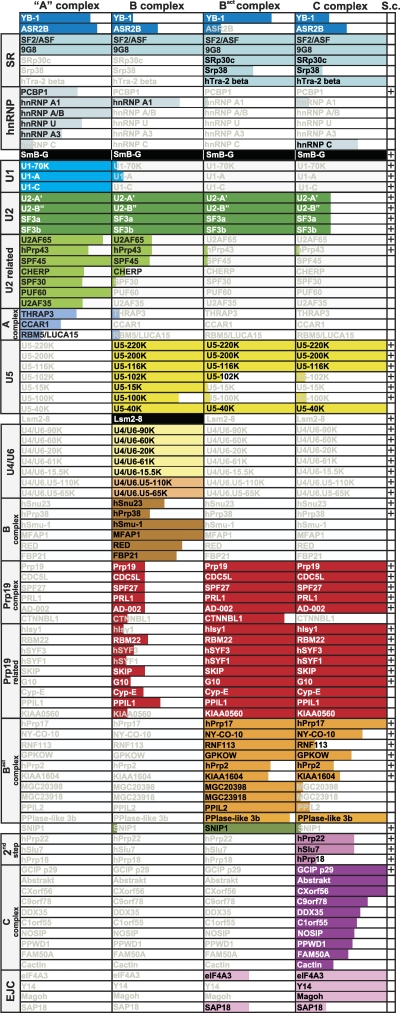
Fig. 9.
Major components of the human A, B, Bact, and C spliceosomal complexes. Only proteins with PAF values above 30 are shown. Note that CBP20/CBP80, as well as individual Sm, LSm, SF3a, and SF3b proteins, are not shown (see also Table 1). The extent of color shading in each column reflects the abundance of each protein, where the entire box is colored for proteins with PAFs above 75. Note that SRSF9, SRSF10, and hTra-2 beta are abundant in A and/or B complexes formed on PM5 but not on MINX pre-mRNA. In the “S.c.” column, a “+” indicates that a homolog is present in the yeast S. cerevisiae.

