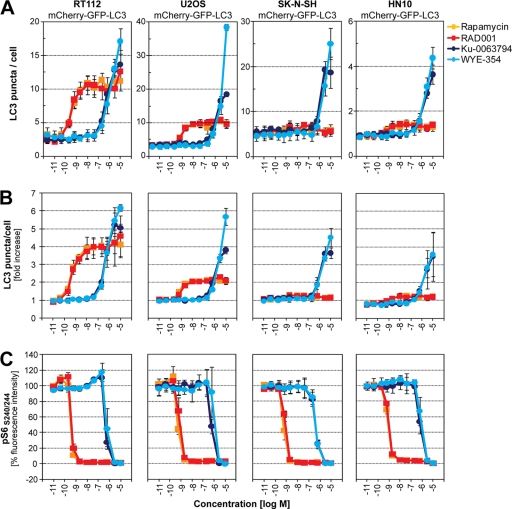
Fig. 3.
Autophagy is indifferent to rapamycin and RAD001 in SK-N-SH and HN10 cells. RT112, U2OS, SK-N-SH, and HN10 cells stably expressing mCherry-GFP-LC3 were grown in 384-well plates and treated for 18 h with serial dilutions (11 pM to 12 μM) of rapamycin, RAD001, Ku-0063794, or WYE-354. Cells were fixed and stained with Hoechst, and autophagy was quantified using high-content imaging and analysis. (A) Absolute numbers of mCherry puncta quantified per cell. A representative experiment is shown, and each data point represents averaged data from four wells ± standard deviation. (B) Relative autophagy activation calculated as fold induction of mCherry puncta. Each data point represents averaged data from three independent experiments ± standard deviation. (C) Cultures in 384-well plates were subjected to immunostaining against phosphorylated ribosomal protein S6-S240/244 using a phospho-specific primary and Cy5-conjugated secondary antibody. Cellular Cy5 signal was quantified using high-content imaging and analysis. Each data point represents averaged data from three independent experiments ± standard deviation.

