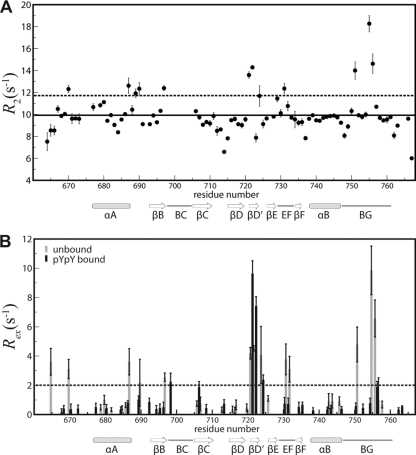
Fig. 7.
Heteronuclear relaxation for unbound and pYpY-bound Vav1 SH2. (A) Transverse relaxation rate, R2, for the residues in the free Vav1 SH2 plotted as a function of residue number. The solid line indicates the average rate (9.97 s−1), and the dashed line is shown at 11.70 s−1 for 1 standard deviation above the mean. (B) Rex values (gray, free Vav1 SH2; black, Vav1 SH2-pYpY complex) from the model-free analysis as a function of Vav1 SH2 residue number. The dashed line is shown at 2 s−1.

