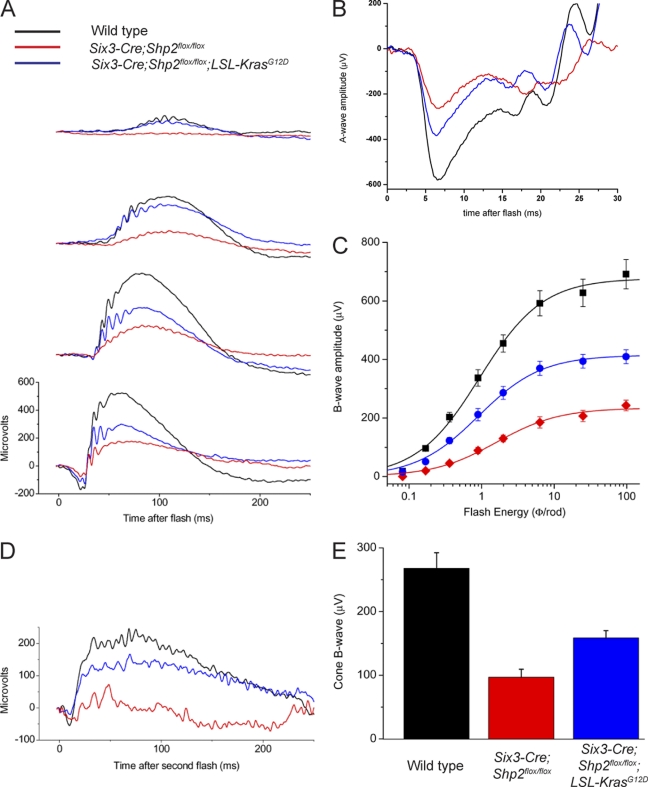
Fig. 7.
Functional recovery of the electrophysiological responses in the Six3-Cre; LSL-KrasG12D; Shp2flox/flox retina. (A to C) Scotopic (rod-dominated) electroretinogram recording (ERG) responses to single flashes of light. (A) Representative traces at four increasing flash energies; (B) representative saturated A-wave traces; (C), rod B-wave amplitude versus flash energy with Naka-Rushton fitted curves. (D and E) Double-flash ERGs to isolate cone responses. (D) Representative traces in response to second flash; (E) average cone B-wave amplitudes for each of the three cohorts. Three-month-old adult mice were used for the ERG tests. The means ± standard errors of the means (SEM) (error bars) are shown.

