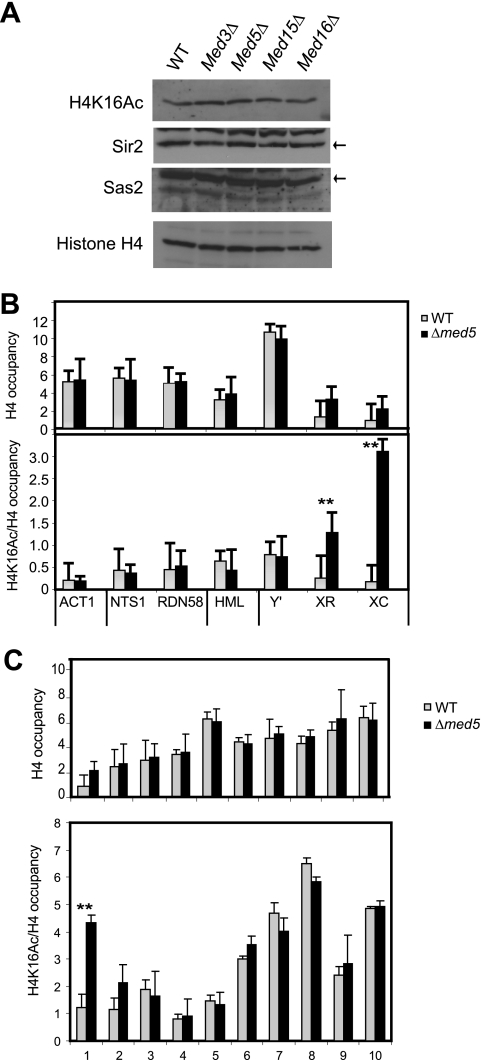
Fig. 4.
H4K16 acetylation levels change in med5Δ mutant cells. (A) Western analyses revealed that the overall levels of Sir2, Sas2, H4K16 acetylation, and H4 remained unchanged in a med5Δ strain (CGC117) compared to a wt strain (BY4741). The Sir2 and Sas2 proteins are indicated with black arrows. (B) ChIP analysis of histone H4 levels and H4K16 acetylation in med5Δ and wt cells. The genomic locations are indicated in Fig. 2. (C) ChIP analysis of histone H4 and H4K16 acetylation levels near telomere 7L. H4K16 acetylation and histone H4 occupancy were normalized to the input. H4K16 acetylation was also normalized to the histone H4 level. Error bars indicate standard deviations calculated for at least three independent cultures. **, P < 0.05.

