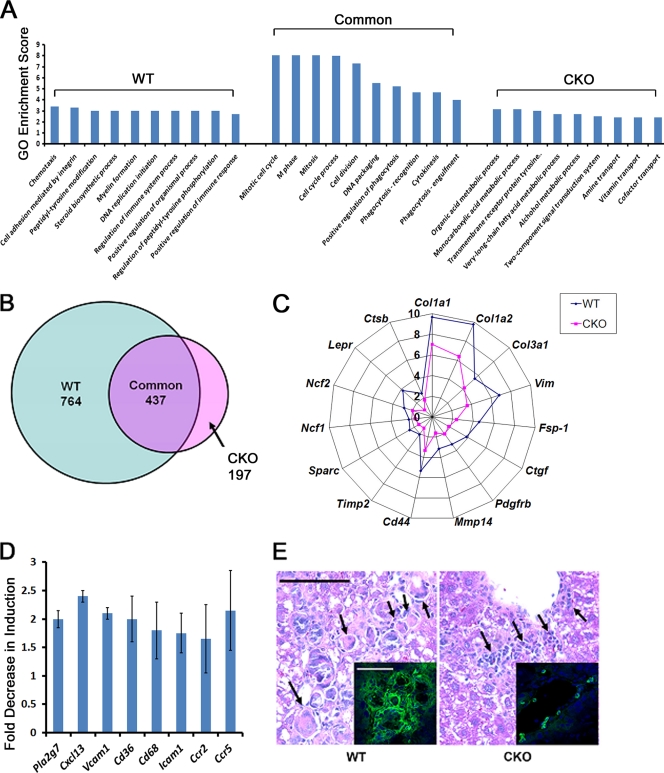
Fig. 6.
Induction of Snail1-dependent profibrotic and proinflammatory gene expression programs during hepatic fibrogenesis. (A) RNA was isolated from uninjured livers or from livers from both WT and CKO mice treated with CCl4 for 2 weeks. Three separate livers were analyzed for both treatment conditions for each genotype. RNA was labeled and hybridized to Affymetrix microarrays for analysis of gene expression, and differentially expressed probe sets were identified for each of the four conditions (significantly changed probe sets were differentially expressed at least 2-fold in CCl4-treated tissue compared to uninjured tissue; P ≤ 0.05). The transcripts were classified as significantly altered by CCl4 in WT livers uniquely or in CKO livers uniquely or altered by CCl4 in both genotypes (Common). Each of the three groups of probe sets was applied to GO biological process analysis. The GO enrichment scores (negative logarithm of the P value) for the top 10 most significant terms for each probe set group are presented. n = 3 livers hybridized for both genotypes and treatment conditions. (B) Venn diagram demonstrating differentially expressed probe sets for the unique WT and CKO and the common groups. (C) The fold increases in expression levels of selected fibrosis-related genes in response to CCl4 in both WT and CKO livers were determined. (D) Induction of a panel of genes associated with the inflammatory response in response to CCl4 in WT and CKO livers was measured by microarray analysis. All eight genes were induced significantly in WT livers, but not CKO livers. The fold decrease ± SEM in induction of expression in CKO livers compared to WT livers is presented for each gene (P < 0.05; n = 3). (E) Hematoxylin- and eosin-stained tissues from WT and CKO CCl4-treated mice were examined to assess immune cell infiltration. The arrows indicate multinucleated giant cells in WT tissue (left) and mononuclear cell infiltrates in CKO tissue (right) (scale bar = 50 μm). (Insets) Tissues were stained for CD11b (green) and counterstained with TOTO-3 (blue) (scale bar = 50 μm).

