
Fig. 6.
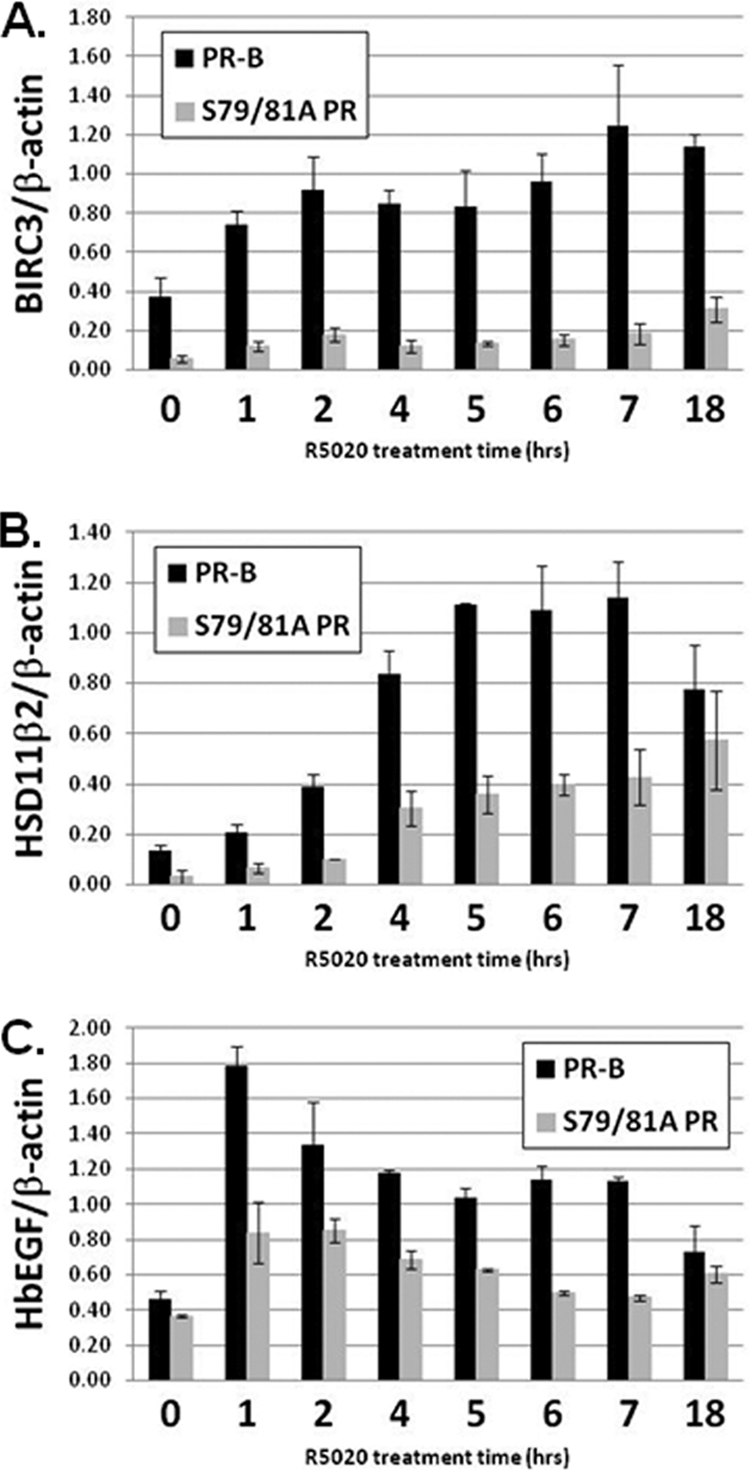
Time course of endogenous gene expression in wt and S79/81A PR-expressing cells. T47D-Y cells stably expressing either wt PR-B or S79/81A PR were starved for 18 h in serum-free medium, followed by treatment with 10 nM R5020 for 0 to 18 h. BIRC3 (A), HSD11β2 (B), HbEGF (C), or β-actin (internal control) mRNA levels were analyzed by qPCR. Statistical significance (P < 0.05; determined using an unpaired Student's t test) was achieved for all time points when comparing wt PR-B- and S79/81A PR-expressing cells with the following exceptions: HSD11β2 (18 h) and HbEGF (0 and 18 h). Error bars represent means ± SD of triplicate measurements.