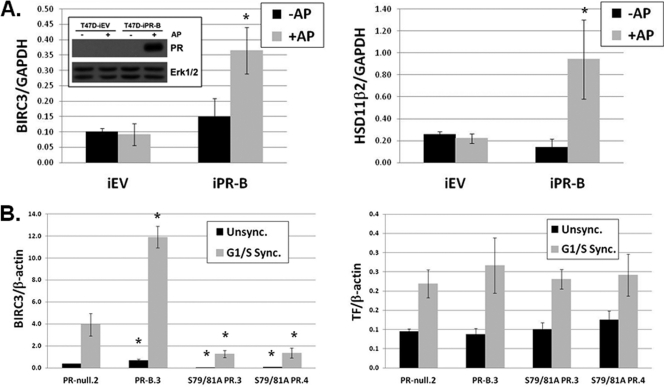
Fig. 7.
Basal transcriptional regulation of phospho-Ser81-dependent genes. (A) T47D-iEV and T47D-iPR-B cells were treated for 48 h with 1 nM AP21967 (+AP and −AP) or vehicle (EtOH) to induce PR-B expression (inset). BIRC3 (left), HSD11β2 (right), or GAPDH (internal control) mRNA levels were analyzed by qPCR. Asterisks (*) indicate statistical significance (P < 0.05; determined using an unpaired Student's t test) compared to the respective treatment group (+AP or −AP) in control cells (iEV), as well as in response to treatment (+AP or −AP) within each cell line. (B) T47D-Y cells stably expressing wt PR-B (PR-B.3), S79/81A PR (S79/81A PR.3 and S79/81A PR.4), or PR-null (PR-null.2) were G1/S synchronized as described in the legend to Fig. 2D. BIRC3 (left), TF (right), or β-actin (internal control) mRNA levels were analyzed by qPCR. Asterisks indicate statistical significance (P < 0.05; determined using an unpaired Student's t test) compared to the respective treatment group (Unsync. or Sync.) in control cells (PR-null.2). Error bars represent means ± SD of triplicate measurements.

