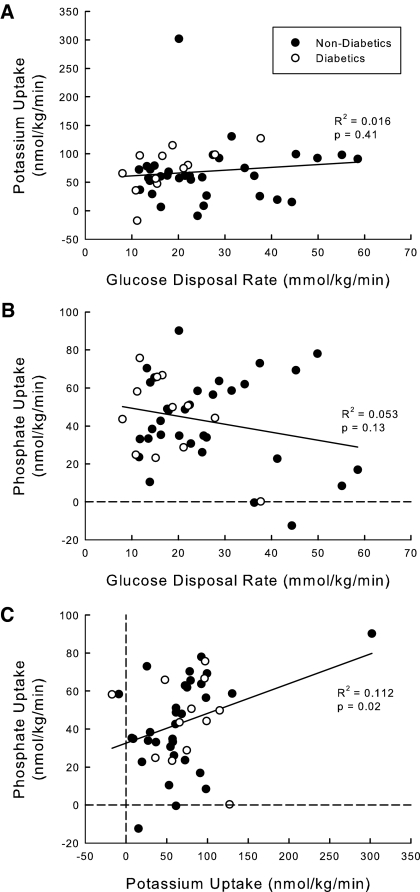
Figure 2.
Relationship between uptake of three solutes: (A) potassium versus glucose, (B) phosphate versus glucose, and (C) phosphate versus potassium. Forty-five subjects with a wide range of BMIs underwent hyperinsulinemic euglycemic clamp. Glucose disposal rate was calculated from the glucose infusion required to maintain euglycemia. Potassium and phosphate uptake were calculated as the reduction in extracellular potassium or phosphate corrected for urinary excretion. The correlation coefficient was calculated for the relationship between the x and y values as well as the P value for the R2.

