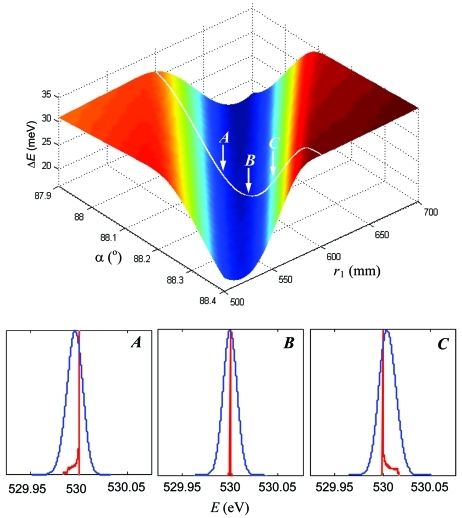
Figure 4.
(Top) Resolution as a function of r 1 and α calculated for an energy of 530 eV and Δα of 3 mrad. The bottom of the valley corresponds to an exactly symmetric line profile. This is illustrated (bottom) by evolution of the lineshapes through the points A, B and C across the valley, calculated without (red) and with (blue) ΔE G broadening.

