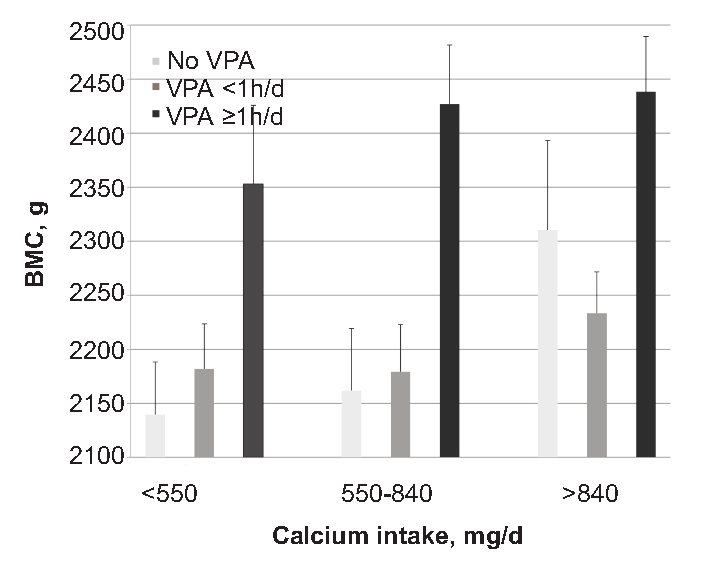
Figure 1.

Illustration of the joint relations of vigorous PA and calcium intake to bone mineral content. BMC (SE), adjusted for age, race and sex, in relation to categories of calcium intake and vigorous PA. Although the statistical analyses were done on continuous variables, the figure breaks the calcium and vigorous PA variables into groups for purposes of illustration. For calcium intake, the youths were broken down into thirds; thus, there were 220 in each category. The number of youths in each of the vigorous PA categories is given in the legend. Both calcium intake and vigorous PA explained significant independent proportions of the variance in BMC (P<0.01) beyond the variance explained by age, race and sex (see Table 3). BMC, bone mineral content; PA, physical activity.
