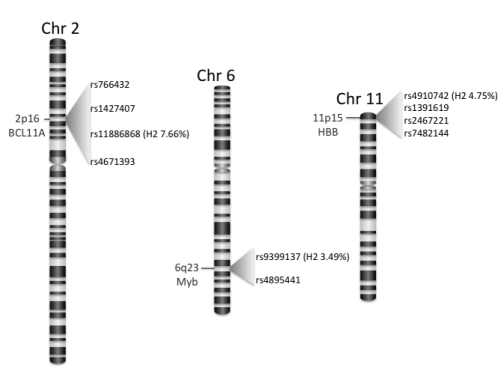
Figure 2.
HbF associated SNPs. Chromosome bands, associated genes and relative SNP positions are indicated. Variance of the HbF (H2) in the Sardinian population is shown in parenthesis for the SNPs with the highest association at each locus. SNP, Single nucleotide polymorphysm; HBF, fetal hemoglobin.

