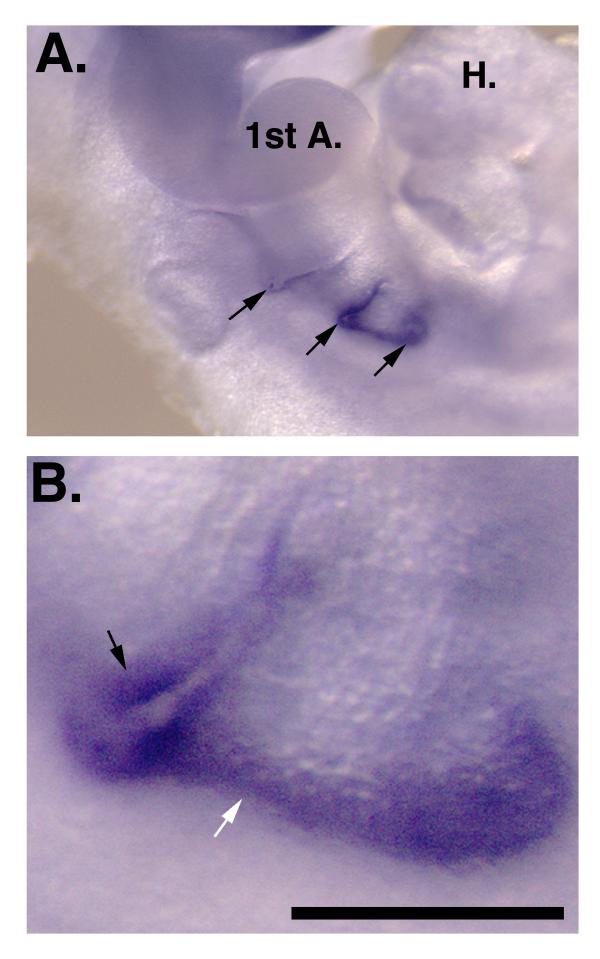
Figure 2.
Gad1 expression in the pharyngeal region. (A) Expression in the pharyngeal pouches and arches (arrows). The first arch (1st A) and heart (H) are indicated. (B) Higher magnification of the third pharyngeal pouch illustrating high levels of Gad1 expression in the dorsal third pouch endoderm (black arrow) and diffuse expression in the mesenchyme caudal to the third pouch (white arrow). Scale bar: A 1 mm; B, 100 μm.

