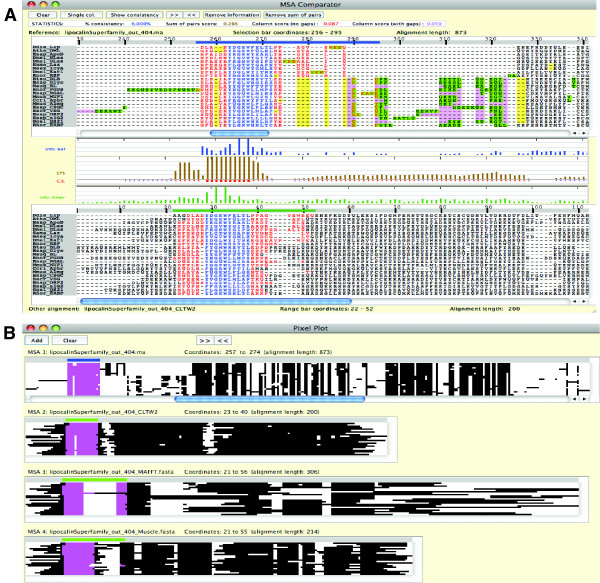
Figure 10.
MSA comparisons for simulated lipocalin-superfamily protein sequences. Twenty-three protein sequences of the lipocalin superfamily were simulated using iSGv2.1. Simulated sequences were aligned using ClustalW2 v2.1, MAFFT v6.846, and MUSCLE v3.8.31. Panel A shows the comparison of the MSA reconstructed by ClustalW2 against the true alignment provided by iSGv2.1 (the reference alignment) using the MSA Comparator. The column-wise SPS along with the information content for each alignment are displayed between the two alignments,. In Panel B, the Pixel Plot is used to compare the three reconstructed MSAs (MSAs 2-4) against the reference alignment (MSA 1).

